Last week was the end of the Google Summer or Code season. Out of two projects that we had been mentoring one was not really about biology. It was a project for system administrators. A visualization tool for staistics about cpu usage, memory, disk space etc.
Everybody who runs involved biodiversity informatics projects knows how important it is to monitor your systems. There are several open source tools for that – Nagios, Sensu, Graphite, Systemd, Collectd…
Our monitoring system of choice is Sensu. It is very flexible and powerful tool, well designed and suitable for large number of tasks. One of these is collecting statistics from computers and store them in about any kind of database. As a result Sensu can be used for monitoring critical events and for collecting data about systems. The question is however how to visualize all the collected data.
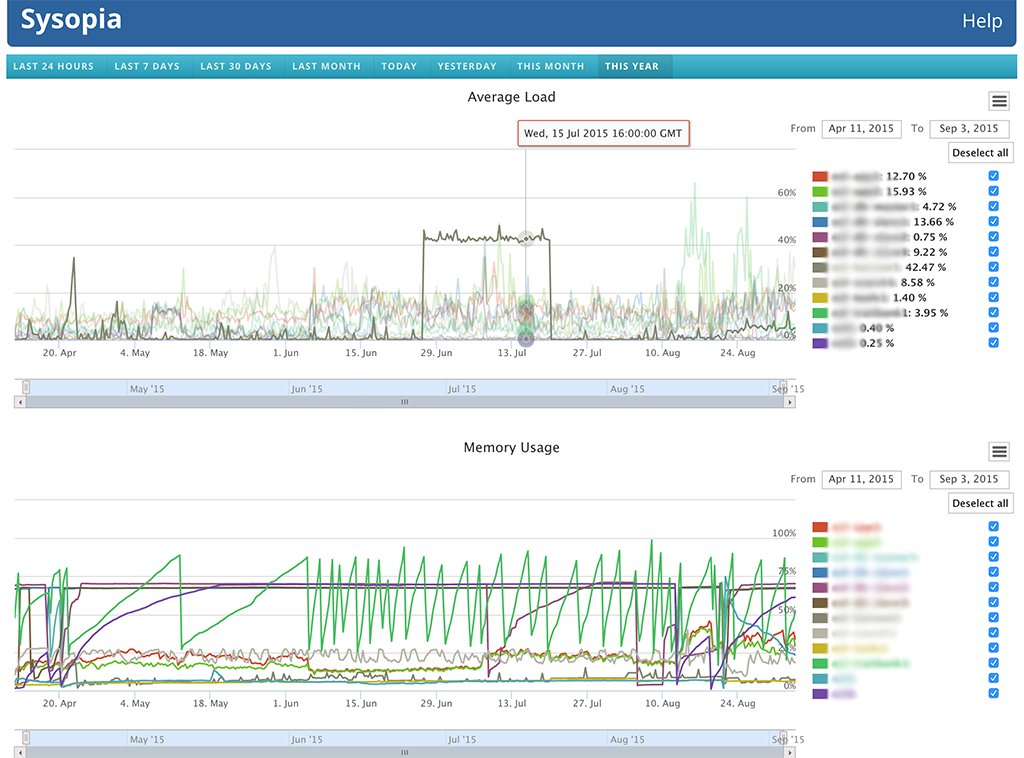
We designed Sysopia to do exactly that. During the summer @vpowerrc expanded original prototype and created powerful and flexible visualization tool which is capable to give system administrator an understanding what is happening with 2-20 computers at a glance, receive life updates, and compare today’s statistics with up to one year of data. We already use Sysopia in production, and we are going to deploy it for Global Names as soon as our new computers are in place.
You can read more about sysopia on its help page